
Niagara Performance Profiling — how to understand what slows things down?
Optimizing without profiling is like treating an illness without a diagnosis. In complex scenes or projects with many visual effects, it’s easy to fall into a trap: something is lagging, but you don’t know what exactly. That’s why profiling is the first and most important step.
Main tools for profiling Niagara:
| Tool | Purpose |
|---|---|
| Niagara Debug HUD | Shows info about Niagara Systems on screen |
stat Niagara | Shows detailed stats for systems, emitters, and particles |
stat GPU | Shows GPU render time for different stages |
GPU Profiler (Ctrl+Shift+,) | Breaks down GPU timing by category |
| Timing Insights | Deep CPU/GPU analysis per frame, including Niagara effects |
How to read stat GPU?
This command helps quickly see how much time each render step takes. Pay attention to: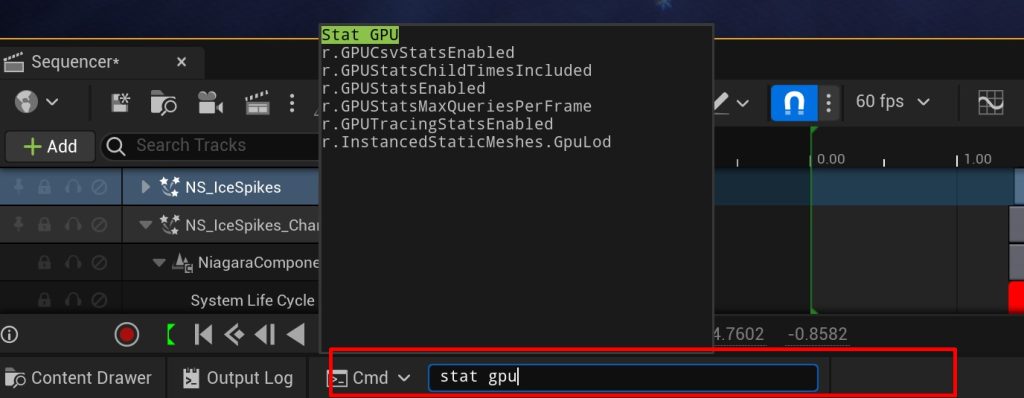
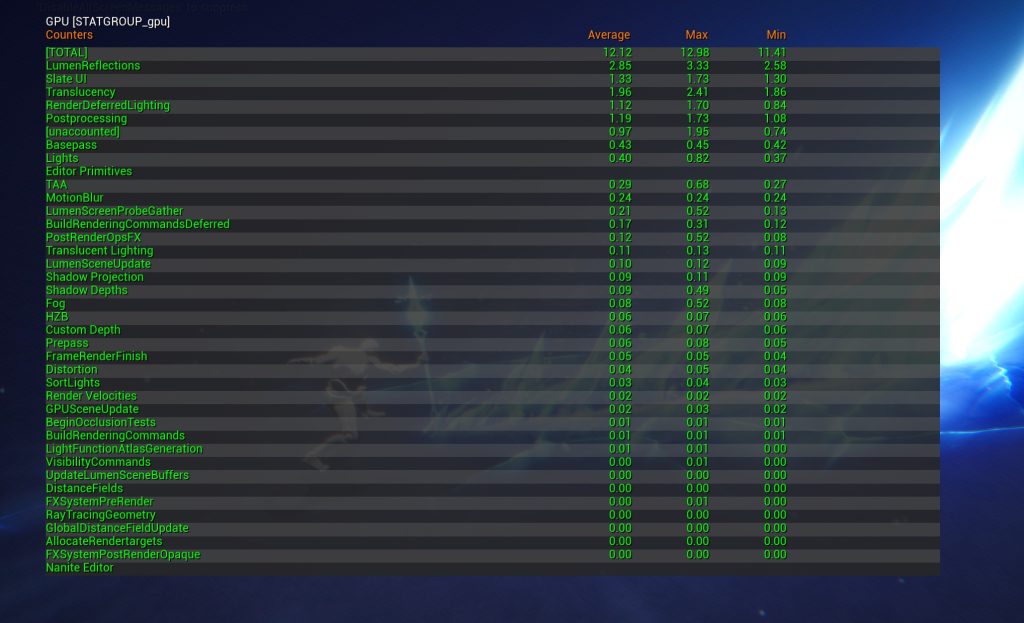
Translucency: usually includes Niagara. If it takes 3+ ms, your effects might need optimization.
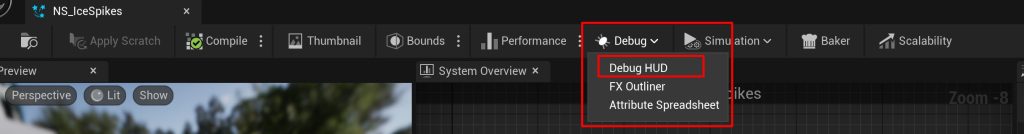
What to watch in Niagara Debug HUD?
It shows real-time info:
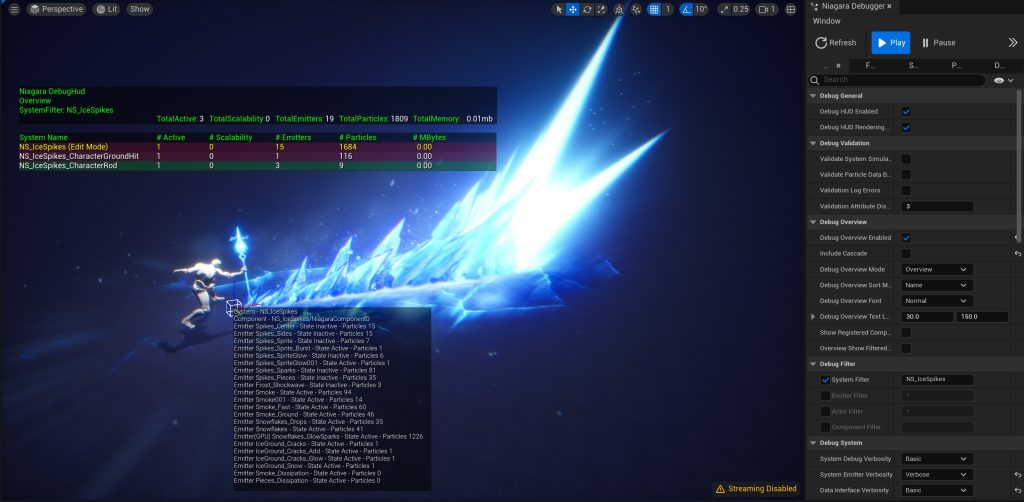
Number of active particles in the system currently playing
Active particle counts per emitter
Memory use, scalability level, emitter count, etc.
What does stat Niagara show?
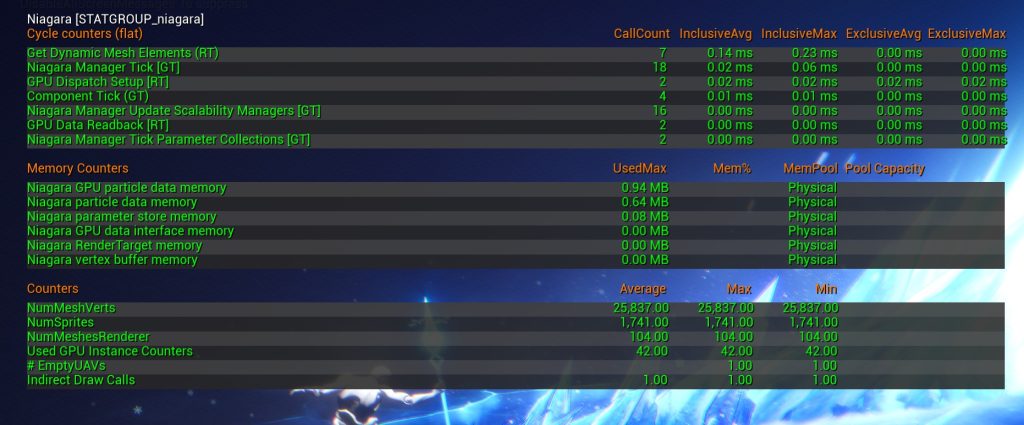
A text list of all active systems:
Niagara GPU Time
Number of Ticked Systems / Emitters
Number of Mesh Vertices
Memory Counters
GPU Profiler — what to look for?
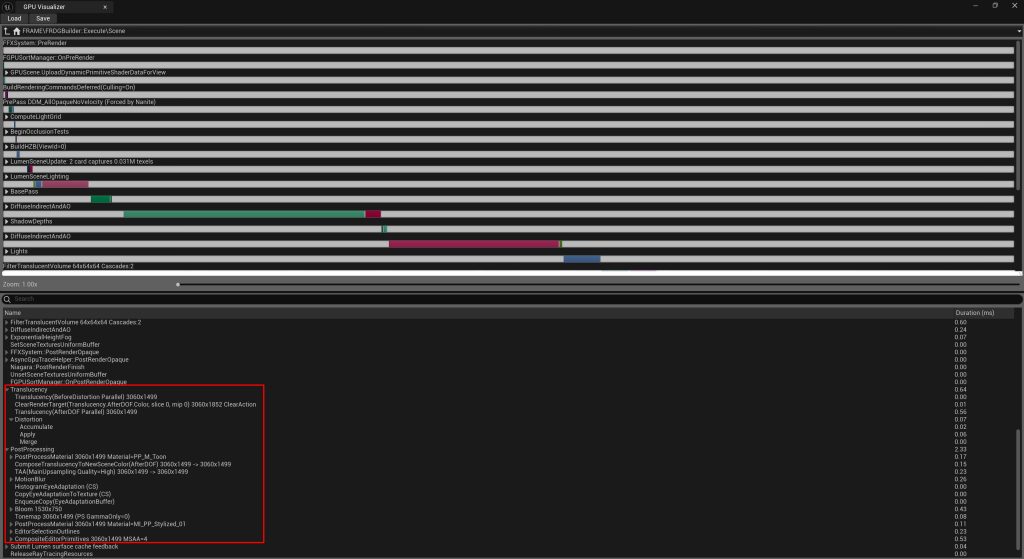
Press Ctrl + Shift + , to open the GPU Profiler:
Niagara::Tick= GPU simulation timeNiagara::Render= how long particle rendering takesMaterials= which materials are the most expensive
Example: Niagara::Render = 1.8 ms — this is high. If you have multiple effects like that, FPS will drop.
Timing Insights
From Unreal Engine 5.4, you get Timing Insights — a powerful new tool that expands the GPU profiler. It shows exactly which systems and materials are taking GPU time — in a visual, easy-to-understand way.
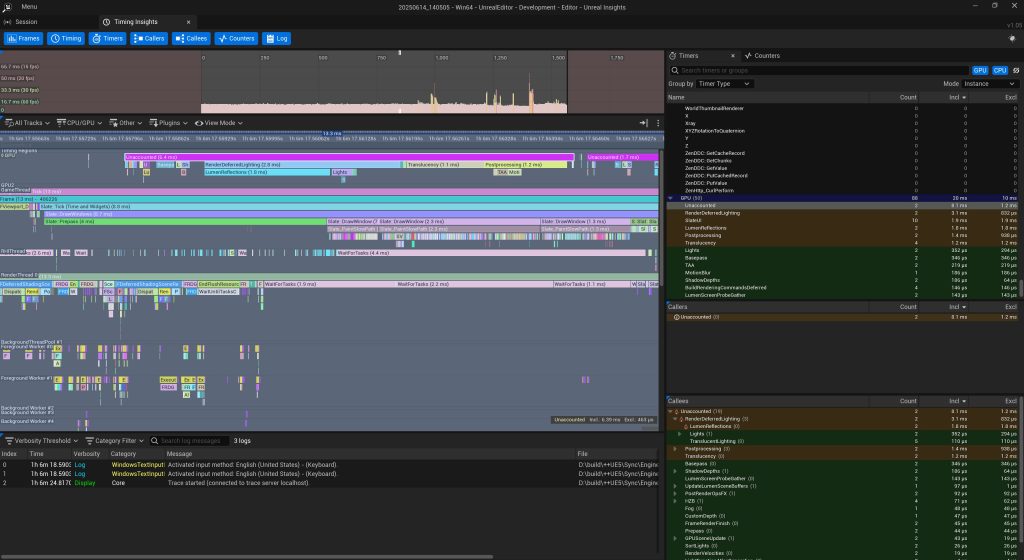
Features:
Shows time per call: Niagara::Tick, Niagara::Render, Materials
Displays rendering branches in a hierarchy
GPU/CPU events shown per frame
Great for debugging complex scenes with multiple active systems
How to use:
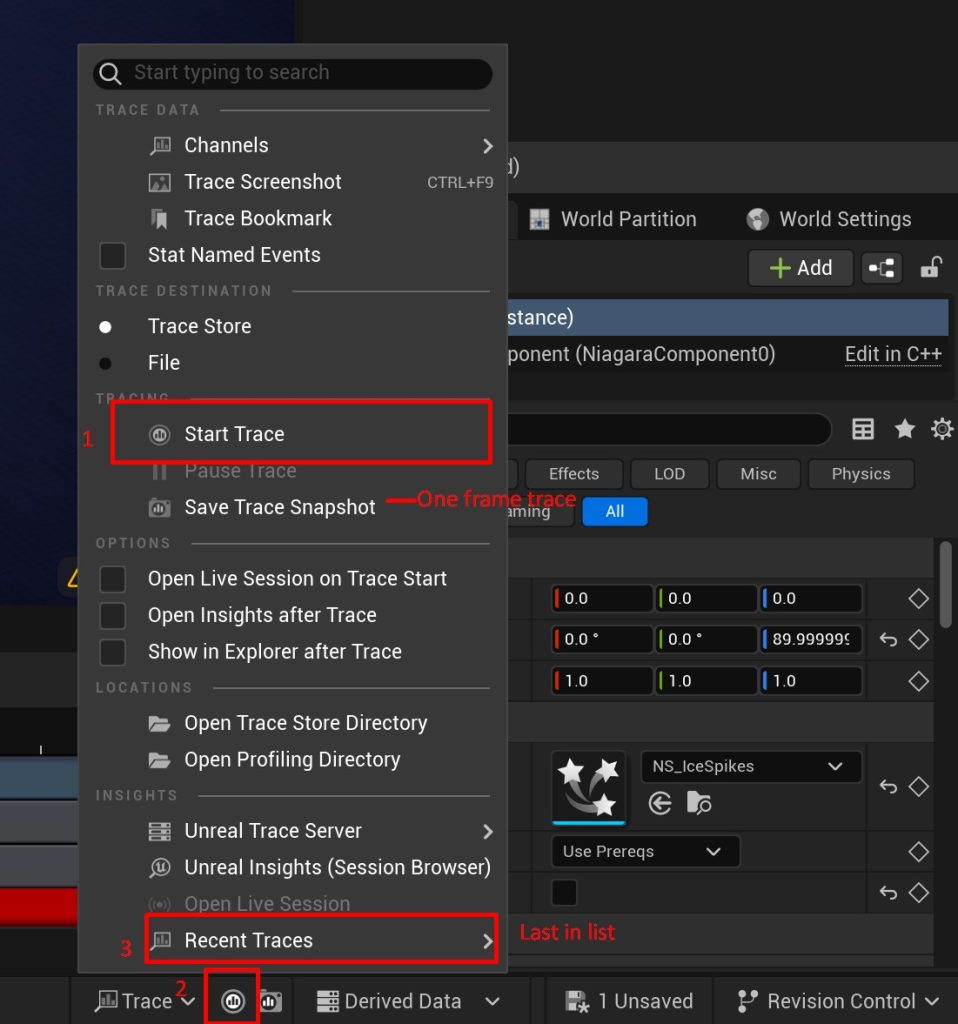
Go to Trace
Pick a frame from the timeline to analyze
Each system is labeled and color-coded
Why is this better than the GPU Profiler? It catches even small or hidden performance issues — like Material Proxies, Dynamic Parameters, or heavy Post Process passes.
Niagara Effect Example
Scene: explosion causes FPS drops.
Debug HUD: 5 systems, each with 3 emitters, ~300 particles
stat Niagara: Niagara Tick Time = 6.2 ms → performance issue
GPU Profiler: one material takes 0.9 ms alone → needs optimization
Conclusion:
Merge emitters
Reduce shader complexity
Add
KillAfterTimeSplit the effect into 2 systems: core + extras
What is a normal Niagara Tick Time?
| Platform | Niagara Tick Time | Notes |
|---|---|---|
| PC High-End | < 2–3 ms | Acceptable |
| PS4 / Xbox One | < 1.5 ms | Very limited budget |
| PS5 / XSX | < 2 ms | More headroom |
| Mobile | < 1 ms | Every ms matters |
| VR / AR | < 1 ms | Everything renders twice |
Practical Tips
Turn off Niagara Systems when they are offscreen (camera frustum culling)
Use Fixed Bounds to reduce per-frame calculations
Profile effects in isolated scenes
Use a full set: GPU Profiler + Timing Insights + stat Niagara + Shader Complexity
Effect Culling & Scalability — how to manage Niagara VFX performance
In big projects with lots of effects, it’s important not only to create great visuals — but also to control when and how they appear. That’s what Culling and Scalability are for.
What is Culling in Niagara?
Culling = automatically turning off effects when not needed.
Examples:
Particles not visible to the camera → disable them
Effects too far from the player → disable them
Too many particles on screen → limit them
This is controlled via Niagara Effect Type and Scalability Settings.
🔹 Use Fixed Bounds for stable culling (no dynamic bounding box changes)
Niagara Effect Type — the control center
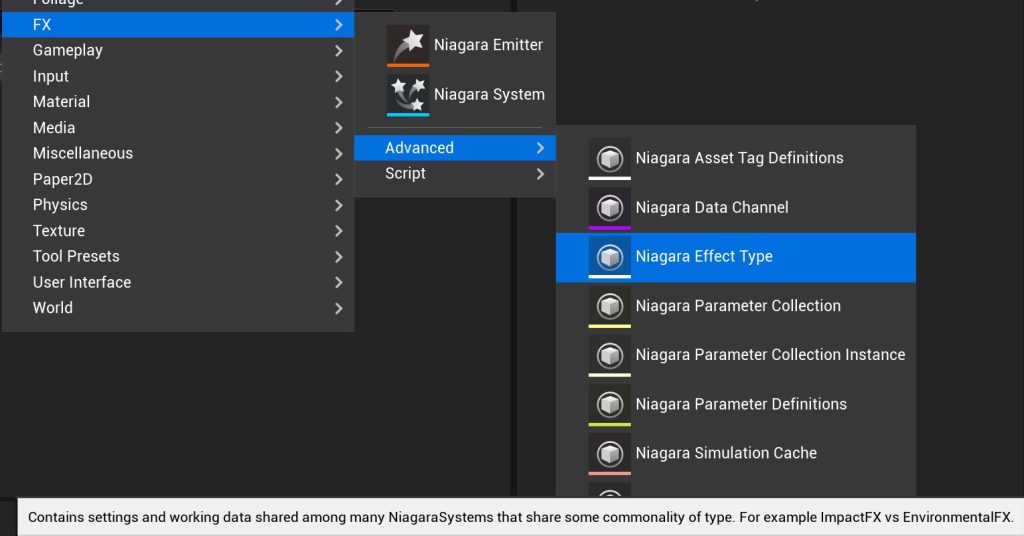
Niagara Effect Type is a global settings asset for controlling scalability, culling, and performance budgets.
Create in Content Browser:
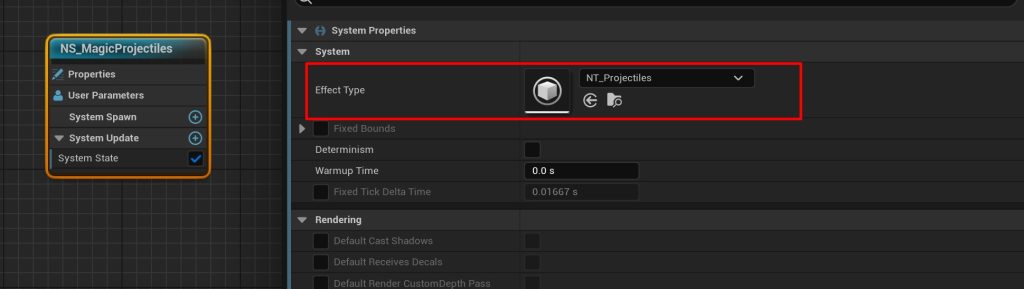
Add New → FX → Advanced → Niagara Effect TypeAssign it to each Niagara System (under
Effect Type)
Why use Niagara Effect Type?
Global control over culling/scalability
Limits how many Systems/Emitters can run at once
Defines effect importance (Significance)
Sets performance budgets
📘 Official guide: Niagara Scalability & Effect Types
Scalability Settings in Effect Type
| Setting | Description |
|---|---|
| Spawn Count Scale | Reduce number of particles |
| Update Frequency | Fewer updates = less CPU/GPU load |
| Cull Distance | Disable effects beyond a distance |
| Max Instances | Limit how many effects are active |
Scalability Overrides per System
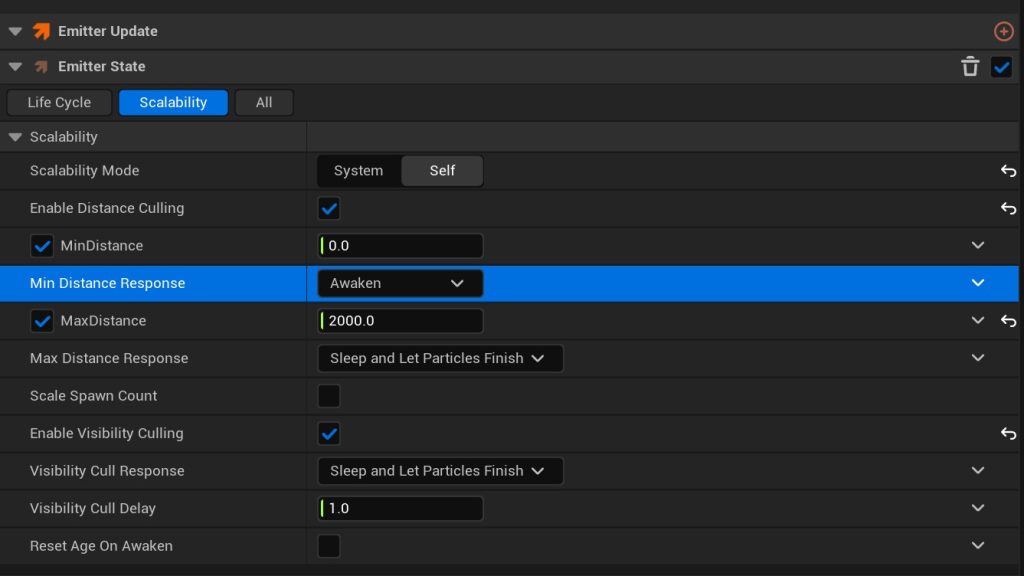
In each Niagara System, there is a separate Scalability menu that allows you to specify the quality settings in which the effect will operate, as well as how its behavior will change depending on the game settings level.
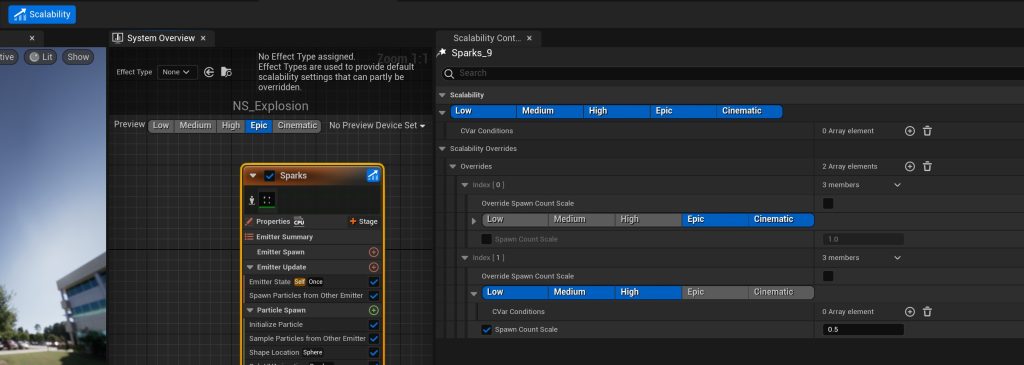
You can also override settings per Niagara System:
Go to Niagara System → Scalability tab → Enable Overrides
Here you can:
Disable specific emitters on lower quality settings (Epic, High, Medium, Low)
Reduce the Spawn Count
Example:
You have a system with 3 emitters:
Core (main effect)
Smoke Trail
Sparkles
You want:
On Epic → All 3 emitters
On Medium → Core + Smoke (with fewer particles)
On Low → Only Core
Solution:
Enable Scalability Overrides
Set Emitter Enable for each quality level
For Smoke Trail → Set Spawn Count Scale = 0.5 (on Medium)
For Sparkles → Disable on Medium and Low
Result:
An adaptive effect that automatically gets lighter when the graphics quality is lowered.
Why is this important?
Each emitter can consume a lot of resources. You don’t always need all the visual details on Low or Mobile settings.
Instead of creating separate effects — just build LOD behavior into a single Niagara System.
This reduces the number of components and improves management.
Where are global setting set?
The system reads settings from the Scalability Settings in the Niagara Effect Type.
However, each system can override these settings locally — using Scalability Overrides.
Niagara Budgets — how to limit effect load
A budget is a limit on how many Niagara Systems or particles can be active.
| Budget Type | Example Value |
|---|---|
| Max System Instances | 100 Systems |
| Max Particle Instances | 10,000 Particles |
In Niagara Effect Type you can configure:
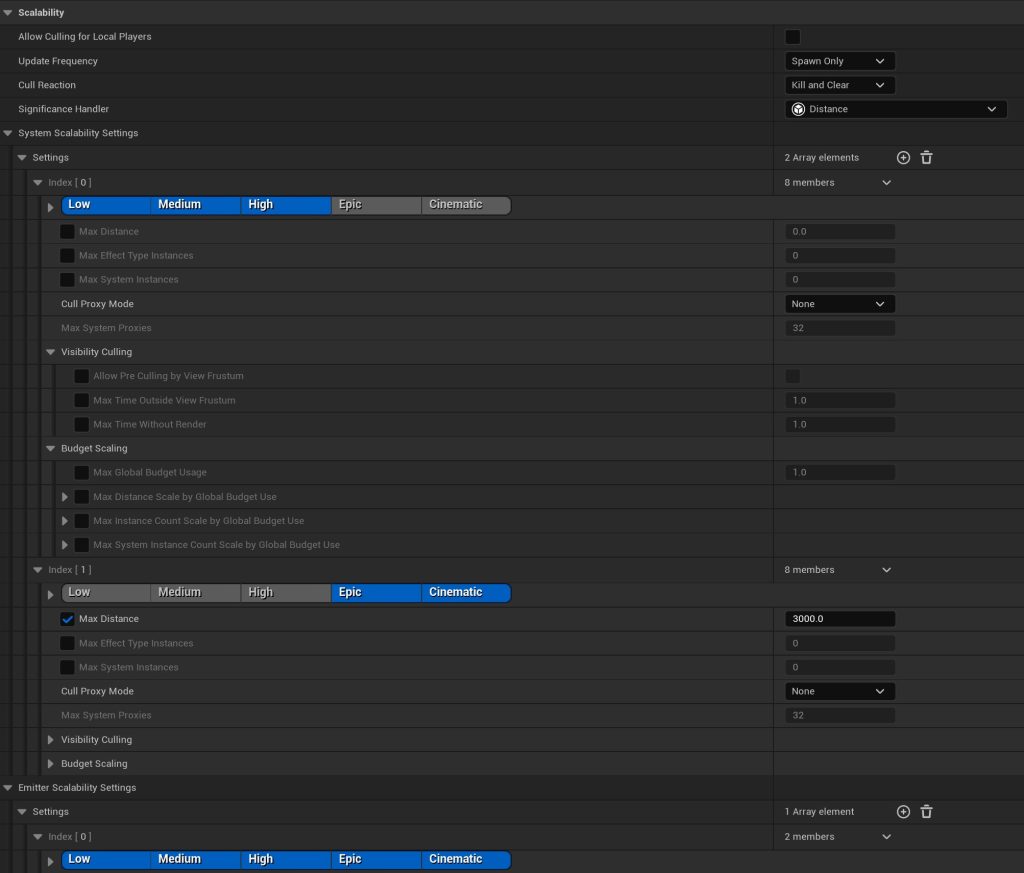
Budget Settings
| Setting | Description |
|---|---|
| Max Distance | Beyond this → effect disappears |
| Max Effect Type Instances | Max systems of this type active |
| Cull Proxy Mode | Replace with null or simple proxy effect |
| Max System Proxies | Max proxy systems allowed |
| Allow Pre Culling by View Frustum | Auto disable if not visible |
| Max Time Outside View Frustum | Seconds allowed offscreen before deactivation |
| Max Time Without Render | If not rendering, how long before deactivation |
Budget Scaling (auto performance drop when overloaded)
| Setting | What it does |
|---|---|
| Max Global Budget Usage | Max GPU/CPU usage allowed (0.0 to 1.0) |
| Max Distance Scale by Budget | Reduces draw distance when overloaded |
| Start/End X,Y | When and how to scale down particle/system counts |
| Max Instance Count Scale by Budget | Reduce particle counts when overloaded |
| Max System Instance Count Scale by Budget | Reduce system count when overloaded |
Significance — choose what matters
Significance Handler controls which effects stay active when over budget.
| Type | Priority Rule |
|---|---|
| Distance | Closer to camera = more important |
| Age | Newer effects = more important |
| Custom | Define via Blueprint or C++ |
Example: bullet impact decals
Lots of Niagara Systems per bullet hit
Set
Max System Instances = 100Use Significance = Distance
Distant decals get culled → better performance
Also works well for environmental effects — not all need to be shown at once.
Best Practices
Use Niagara Effect Type for all systems
Set Cull Distance for non-essential elements (smoke, sparkles, etc.)
Disable decorative emitters on Low/Mobile
Test at all quality levels
Use console commands:
r.NiagaraScalability.*Check Debug HUD to see if culling works
On Mobile/VR: create simplified versions of effects
Use LOD logic for Niagara just like for Static Meshes
Niagara System Lifecycle Optimization
How to avoid “forever running” effects
One of the most common mistakes: forgetting to stop an effect. If a Niagara System or emitter never ends, it continues using resources — even if it’s not doing anything visible.
In large scenes or over long gameplay, this leads to serious performance drops.
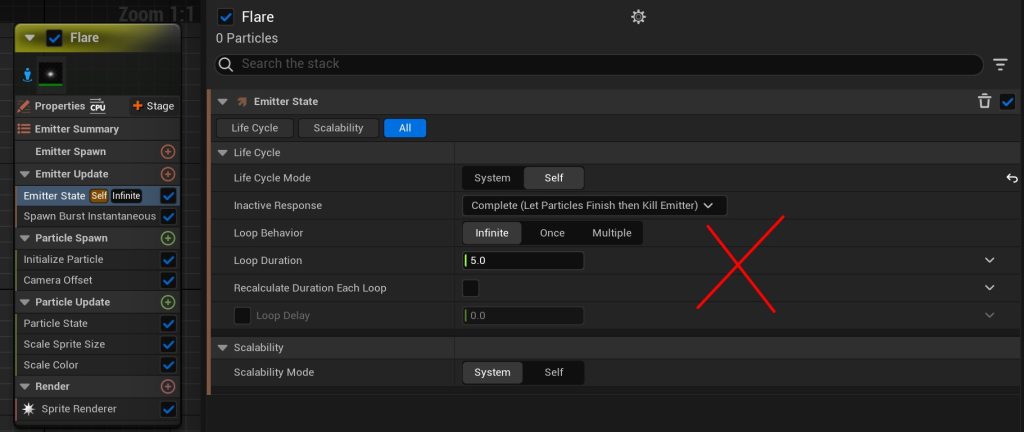
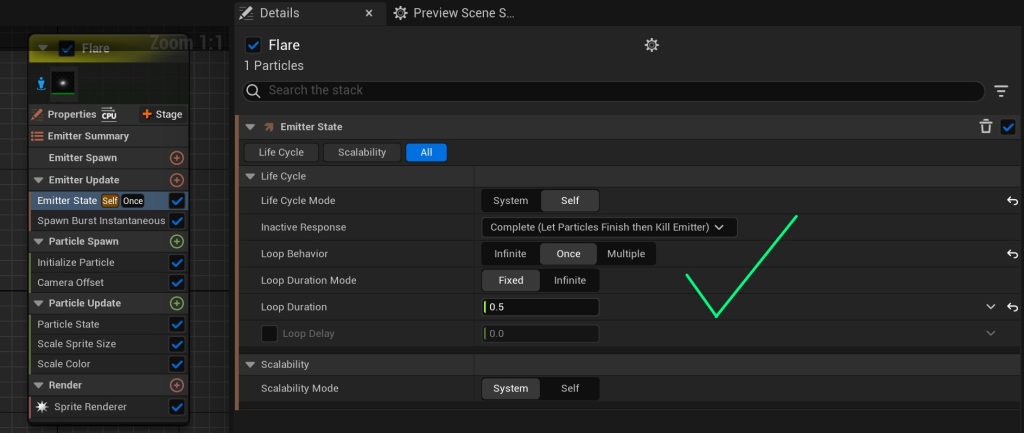
How to fix it:
Set Loop Behavior = Once for one-time effects (like explosions)
Use Auto Deactivate or Kill on Complete
Avoid unused emitters or unnecessary looping
Bad example:
Smoke effect has Loop = true
It keeps running forever
Good example:
Loop = Once
AutoDeactivate = true
Delay Start is used for timing
Kill on Complete per emitter
Debug tools:
Niagara Debug HUD → see live systems and tick times
stat Niagara→ check how many systems are runningSystem Overview → spot emitters running with no particles
Always make sure your effects end properly — not just for logic, but for performance.
Conclusion
Optimizing Niagara isn’t just about saving milliseconds. It’s about managing performance smartly to protect FPS and deliver a smooth player experience.
To keep your VFX clean and fast:
Profile first — use
stat Niagara, GPU Profiler, Timing InsightsControl load — use Niagara Effect Type, Scalability settings, Significance Handler
End cleanly — avoid infinite loops and stop effects when they’re done
These 3 rules will help you build effects that look amazing and run great.

Great work! this is quite clear and straight to the point
Thank you!